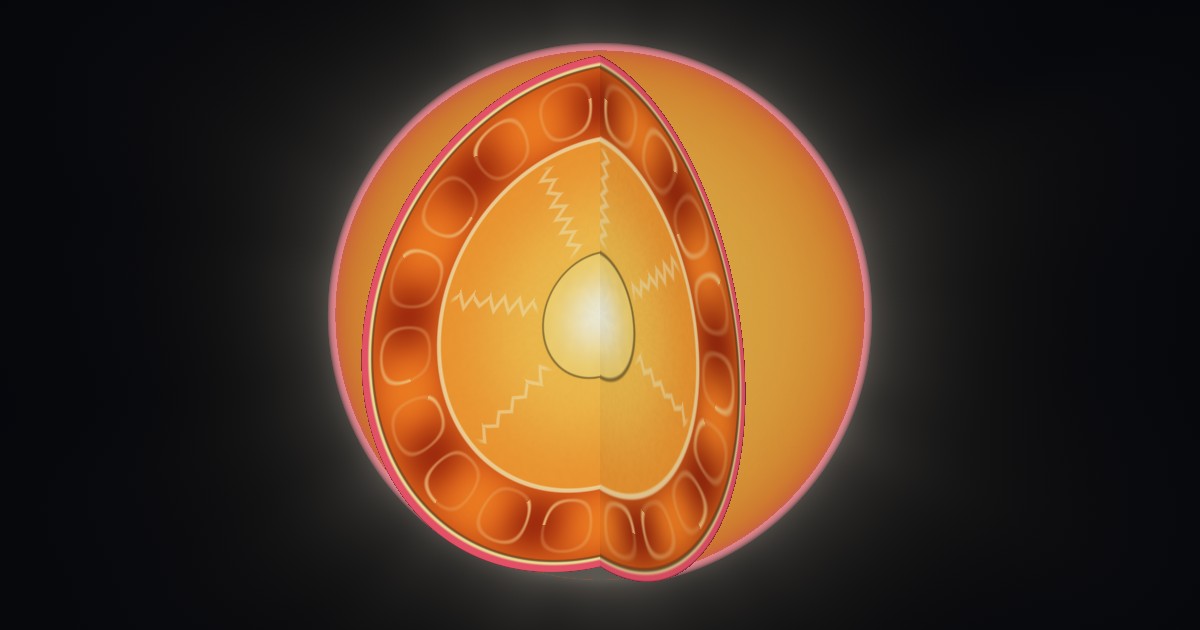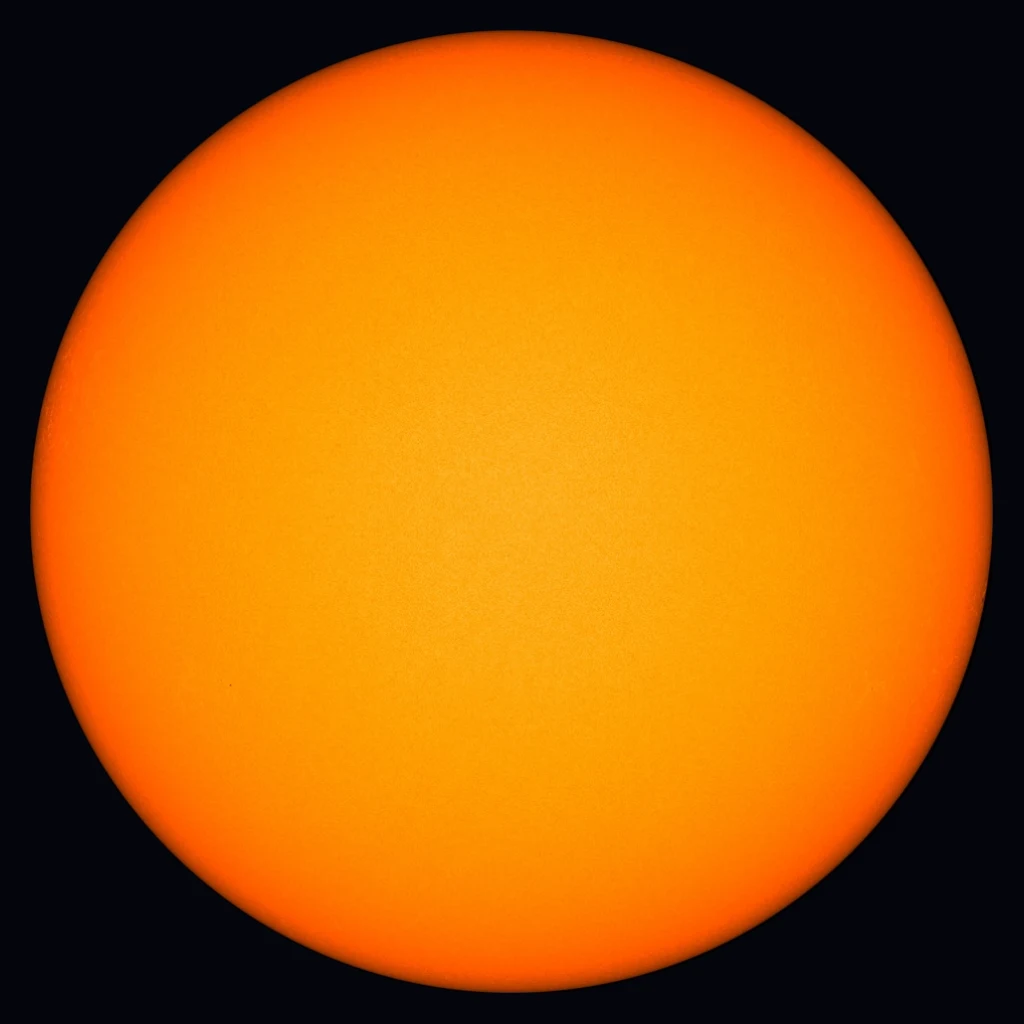
This Sun 3D model is an interactive 3D Sun you can rotate, zoom and cut open. Its Earth-facing side shows today’s real image from NASA’s Solar Dynamics Observatory, refreshed every 3 hours, with the sunspot regions NOAA is tracking pinned on it. Turn on Layers to cut a wedge out of the Sun and see the core, radiative zone, convection zone, photosphere, chromosphere and corona, with a card for each.
Below the model you will find the layers of the Sun in order, what sunspots and solar flares are, how big the Sun is and how to look at it safely. The Sun is one of a dozen bodies in our 3D space models.
How do I use the Sun 3D model?
- Move: drag to rotate and scroll or pinch to zoom. On a phone, tap Explore first. Until you do, swiping scrolls the page.
- Today / Model: Today puts the real NASA image on the side of the Sun that faces Earth. Model swaps it for a generated surface. The far side of the Sun is never imaged here, so it always uses the generated surface and shows no spots.
- Sunspot regions: pins mark the sunspot groups NOAA lists today, each labeled AR (active region) and its four-digit number. Tap a pin for its card. On a day with no regions the button is hidden and the status line reads “Spotless today”.
- Layers: cuts a quarter-sphere wedge out of the Sun. Tap a label or the cut face to open the card for that layer, with its depth, temperature and what happens there. The chromosphere and corona are drawn far thicker than they are, and the model says so: it is not to scale outside the photosphere.
- Status line: gives the time of the image, such as “Today’s Sun: 27 Oct 2026, 17:30 UTC – 2 sunspot regions”. If the latest image is more than 72 hours old, it reads “Latest SDO image” and shows the date instead.
What are the layers of the Sun?
The Sun has six main layers: three inside and three in its atmosphere. From the center out they are the core, the radiative zone, the convection zone, the photosphere, the chromosphere and the corona. Two thin boundary layers sit between them, the tachocline and the transition region. The cutaway above is a Sun diagram you can turn around.
| Layer | Where | Temperature |
|---|---|---|
| Core | Center to 25% of the radius (about 175,000 km) | About 15 million C at the center |
| Radiative zone | 25% to 70% of the radius | About 7 million C at the base, about 2 million C at the top |
| Tachocline | Thin layer at about 70% of the radius | About 2 million C |
| Convection zone | Outer 30%, about 200,000 km deep | About 2 million C at the base, about 5,700 K at the top |
| Photosphere | The visible surface, about 400 km thick | About 5,500 C |
| Chromosphere | Up to about 2,000 km thick, above the surface | About 4,000 C to about 25,000 C |
| Transition region | Thin, irregular layer | Climbs to nearly 1 million C |
| Corona | Millions of km, no sharp edge | Up to about 2 million C |
- Core: hydrogen fuses into helium here, and the process turns 4 million tonnes of matter into energy every second. Nuclear burning nearly stops beyond a quarter of the way out. The core is the densest part of the Sun, about 150 g/cm3 at the center.
- Radiative zone: energy crosses it as light, bouncing from particle to particle. NASA gives the trip from the core as at least 170,000 years, and NASA’s solar physics group at Marshall says about a million. Either way, energy released in the core today takes at least that long to reach the surface.
- Tachocline: the thin boundary at about 70% of the radius, where the smoothly turning radiative zone meets the churning convection zone. Scientists think the Sun’s magnetic field is generated here.
- Convection zone: hot plasma rises, cools at the top and sinks again, like water boiling in a pot. The rising bubbles are what you see on the surface as granules.
- Photosphere: the layer that gives off the Sun’s visible light. More on it below.
- Chromosphere: a thin layer above the surface whose name means “sphere of color”. It shows as a red rim around the Sun during a total solar eclipse.
- Transition region: the layer where the temperature jumps from the chromosphere to the corona. The magnetic field largely controls how the plasma moves here.
- Corona: the Sun’s outer atmosphere. It is thin, with a density about a trillionth of the photosphere’s, yet hotter than the surface below it. Why is still unsolved and is called the coronal heating problem. The solar wind streams out of it, and in April 2021 NASA’s Parker Solar Probe became the first spacecraft to fly into it.
What is the photosphere?
The photosphere is the Sun’s visible surface, the layer that gives off most of the light we see. The Sun is gas all the way through, so there is no solid ground. The photosphere is only about 400 km thick, a sliver next to a radius of 695,700 km, and its temperature averages about 5,500 C (NASA’s effective temperature for the Sun is 5,772 K).
Its texture is granulation. Zoom in on the Model surface and it breaks into bright cells called granules, each about 1,000 km across and lasting about 20 minutes. A granule is the top of a column of hot plasma rising from the convection zone. Larger patterns called supergranules are about 35,000 km wide and last a day or two.
The edge of the disc looks dimmer than the center. This is limb darkening. At the center you look straight down into deeper, hotter gas. Near the edge your line of sight slants through the upper, cooler layers, which give off less light. You can see it in the NASA image in Today mode.
What are sunspots?
Sunspots are dark, cooler patches on the photosphere where concentrated magnetic field lines block heat from flowing up to the surface. NASA puts a sunspot at around 6,000 F (about 3,300 C) against about 10,000 F (about 5,500 C) for the rest of the photosphere. They look dark only by contrast: a sunspot seen on its own would glow brightly. They typically stretch from 1,000 to 100,000 miles across and last from days to months.
Sunspots cluster in active regions, where the magnetic field is strongest. When a group is clearly visible, NOAA’s Space Weather Prediction Center gives it a four-digit region number to track it. That is the “AR” on each pin. As the Sun turns, pins drift across the disc toward the right edge, which is solar west, and slip over the limb. A region card gives the region’s location on the Sun, its number of spots and its sunspot class, along with NOAA’s flare chances. Regions with no spots are plage only and are left off the map.
The solar cycle
The number of sunspots rises and falls in a cycle of roughly 11 years. Cycles are numbered from 1755, and Solar Cycle 25 began in December 2019. On October 15, 2024, NASA and NOAA announced that the Sun had entered the solar maximum of Cycle 25, the most active part of the cycle, and said the maximum period could last about another year. As activity declines toward the next minimum, days with no sunspot regions become more common, which is when the status line says “Spotless today”. Read more in the Sun’s 11-year mood cycle.
What is a solar flare?
A solar flare is a sudden burst of energy released when tangled magnetic fields in the Sun reconnect. Flares erupt from active regions, which is why the region card lists them. Flares are ranked by strength as B, C, M and X, with a 1 to 9 scale inside each letter. Each letter is ten times the energy of the one before, so an X flare is 10 times an M flare and 100 times a C flare.
The card shows NOAA’s forecast chance of M-class and X-class flares from that region. M flares can cause brief radio blackouts near the poles. Strong X flares can cause long-lasting radiation storms that harm satellites and worldwide radio blackouts. The strongest on record, in 2003, saturated the sensors at X17 and was later estimated at about X45. Open two regions and compare their chances.
How big is the Sun?
The Sun is about 1.39 million km (865,000 miles) across, 109 times the width of Earth. Its mass is about 333,000 Earths and its volume could hold about 1.3 million Earths (see the Sun could fit over a million Earths). It sits 150 million km (93 million miles) away, which sunlight crosses in 8 minutes 20 seconds. The Sun formed about 4.6 billion years ago.
It also turns at different speeds: about once every 25 days at the equator and every 36 days near the poles. Surface gravity is far stronger than Earth’s, so you would weigh far more there; the weight on the Sun calculator shows how much.
Looking at the Sun yourself
The model shows what a space telescope sees. To see sunspots from home you need a certified solar filter or solar viewing glasses, and you must never look at the Sun with your eyes alone, sunglasses, a camera or a telescope without one. The same filters work for an eclipse, and the next eclipse finder shows the next one near you.
More about the Sun
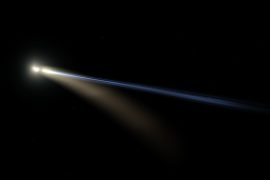
For the spacecraft that study it up close, see space missions to the Sun. The same kind of model exists for the Moon, Mercury, Venus, Earth, Mars, Jupiter, Saturn, Uranus and Neptune, plus an asteroid and a comet.
Questions people ask
What are the layers of the Sun?
The Sun has six main layers. Inside are the core, the radiative zone and the convection zone. The atmosphere is the photosphere, the chromosphere and the corona. The core is about 15 million C and is where hydrogen fuses into helium. The photosphere is the visible surface at about 5,500 C. The corona is thin but reaches up to about 2 million C. Thin boundary layers, the tachocline and the transition region, sit between them. Turn on Layers in the model to see them in a cutaway.
What are sunspots?
Sunspots are dark, cooler patches on the Sun's visible surface where concentrated magnetic field lines block heat from rising. NASA puts them at around 6,000 F (about 3,300 C) against about 10,000 F (about 5,500 C) for the surrounding surface. They typically span 1,000 to 100,000 miles and last from days to months. Their number rises and falls in a cycle of roughly 11 years.
Is the 3D Sun model real?
The Earth-facing side is real. In Today mode it shows the latest SDO/HMI image from NASA, refreshed every 3 hours, with sunspot regions placed from NOAA's data. The far side is a generated surface, since the image only shows the side facing Earth. The layers are an illustration of the standard model of the Sun's interior, and the chromosphere and corona are drawn thicker than they are.
How do I see today's sunspots on the Sun?
Open the model and leave it on Today. Dark spots on the disc are real sunspots in the latest NASA image. Turn on Sunspot regions to pin each group NOAA is tracking, labeled AR and its four-digit number, and tap a pin for its location, spot count and flare chances. If the status line says Spotless today, NOAA lists no regions with sunspots.
What is a solar flare?
A solar flare is a sudden release of energy when tangled magnetic fields in the Sun reconnect. Flares usually erupt from active regions, the areas around sunspots. They are ranked B, C, M and X, and each letter is ten times the energy of the previous one. M flares can cause brief radio blackouts near the poles. Strong X flares can cause worldwide radio blackouts and radiation storms that harm satellites.
How big is the Sun compared with Earth?
The Sun is about 1.39 million km (865,000 miles) across, 109 times the width of Earth. Its mass is about 333,000 Earths, and about 1.3 million Earths would fit inside its volume. It is 150 million km (93 million miles) away, and sunlight takes 8 minutes 20 seconds to reach us.
Where the data comes from
- Today’s image: SDO/HMI continuum, courtesy of NASA/SDO and the HMI science team, from the SDO browse archive.
- Sunspot regions and flare chances: NOAA’s Space Weather Prediction Center solar regions, rotated to the time of the image.
- Size, mass and temperature: the NASA Sun fact sheet and NASA Sun facts.
- Layers: NASA Marshall solar interior, ESA’s Anatomy of our Sun and the National Solar Observatory.
- Sunspots and the cycle: NASA sunspots and NOAA sunspots and the solar cycle. Flares: NASA’s guide to solar flares.
Data verified October 2026. The layers are an illustration of the standard model of the Sun’s interior, not a photograph. To see another world in 3D, open the comet 3D model.