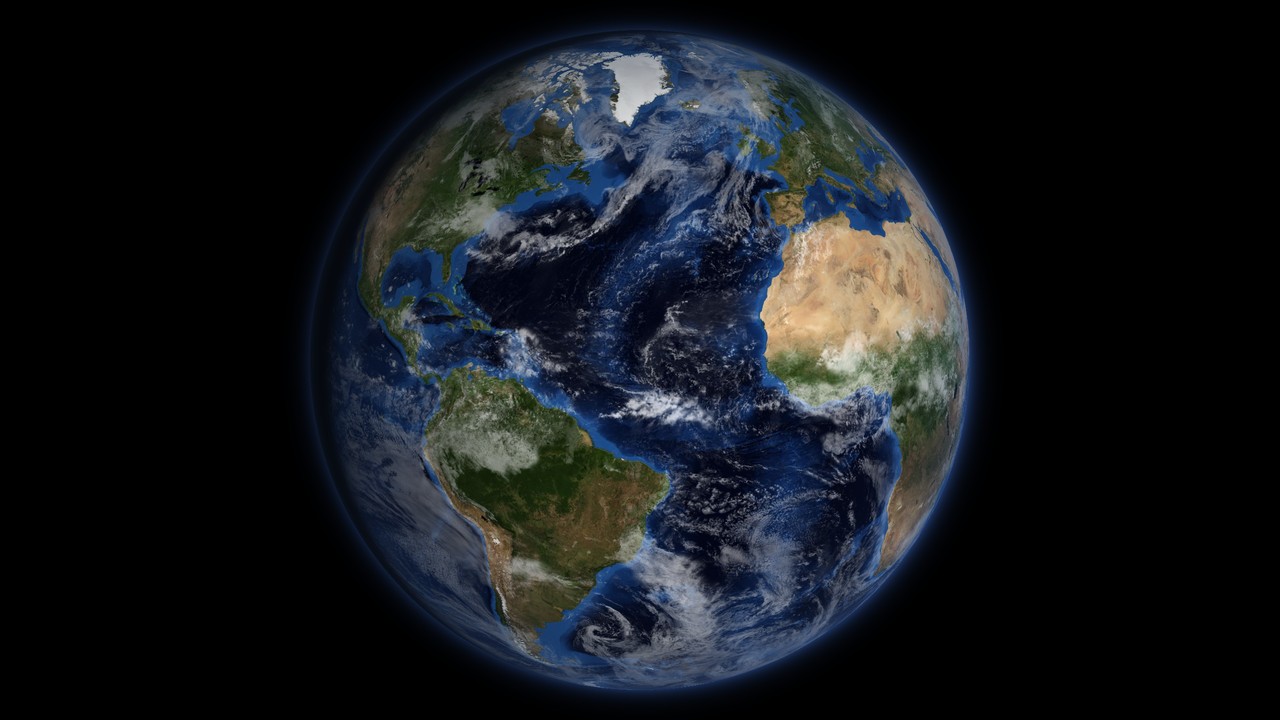
Earth 3D model: an interactive globe and map of Earth
This is an interactive 3D model of Earth with a flat map mode. It shows the planet as it looks from space: NASA satellite imagery for the surface, NOAA relief for the mountains and the sea floor, clouds on top and city lights on the night side. The Sun is placed where it really is right now, so the day and night line on the globe is the real one. Drag the globe to turn it, search for any country, city or landmark, drain the oceans to see the sea floor, or tap any point to read its elevation and its sunrise and sunset times. The clouds and the city lights are composites, not live weather. Earth is 12,742 km across on average. The characteristics of Earth post covers the planet itself. The other planets have their own globes on the 3D space models page.
How to use the 3D Earth map
- Move: drag to rotate, scroll or pinch to zoom.
- Globe or flat map: the mode switch flips between the 3D globe and a flat map of the whole world.
- Layers: toggle continents and oceans, countries, cities, landmarks, country borders, clouds, city lights, the oceans themselves, the latitude and longitude grid and day and night.
- Drain the oceans: turn off the Oceans layer and the water disappears. The sea floor is shown at its real depth, with trenches, ridges and seamounts.
- Tap any point: the panel gives latitude, longitude, elevation or ocean depth, local solar time, the Sun’s height above the horizon, and sunrise, sunset and day length for that day.
- Places: open the Places panel for the highest mountains, ocean depths, volcanoes, deserts, lakes, ice and natural wonders. Click one to fly there.
- Time: move the clock to any date and hour. The day and night line, the city lights and the Sun’s position follow. The Now button returns to the present.
- Search: type a country, city, landmark, ocean or desert to fly to it.
- Terrain exaggeration: raise it to make relief visible from orbit (see below).
- Measure: pick two points to get the great-circle distance and an elevation profile along the line.
- Share: copy a link to the current view, or save a snapshot.
What is real-time and what is not
Two things on the globe are live: the position of the Sun and the day and night line. Both are calculated from the date and time on the clock, using the standard astronomical formulas for the Sun’s position and Earth’s rotation.
Everything else is a fixed image. The surface colour is NASA’s Blue Marble Next Generation composite, built from 2004 satellite passes and shown here in its July version. The clouds are a composite, not today’s weather, so a storm you see on screen is not necessarily there now. The city lights are NASA’s Black Marble map of 2016, so cities built since then are missing. Country borders are the de facto lines of Natural Earth, which show who controls the ground today and not every claim. For current clouds, use a weather satellite viewer.
Why the day and night line tilts through the year
Earth’s axis is tilted 23.44 degrees from the plane of its orbit. As Earth circles the Sun, the point directly under the Sun moves between 23.44 degrees north and 23.44 degrees south. The day and night line, called the terminator, always sits 90 degrees from that point. When the Sun is over the tropics the line tilts across the globe, and when it is over the equator the line runs straight through both poles.
The line itself sweeps west at 15 degrees of longitude an hour, which is Earth turning once in 24 hours. At the equator that is about 1,670 km/h.
- June solstice: the Sun is over the Tropic of Cancer. The northern hemisphere has its longest day, and north of the Arctic Circle (66.56 degrees north) the Sun does not set.
- December solstice: the Sun is over the Tropic of Capricorn. The southern hemisphere has its longest day, and north of the Arctic Circle the Sun does not rise.
- March and September equinoxes: the Sun is over the equator and day and night are close to equal everywhere.
The 2026 dates, from the U.S. Naval Observatory, are 20 March at 14:46 UTC, 21 June at 08:24 UTC, 23 September at 00:05 UTC and 21 December at 20:50 UTC. The time bar shows the season and the next equinox or solstice. Scrub the clock to 21 December and look at the north pole: that is polar night.
Tap a point above the Arctic Circle in June or December and the panel reports polar day or polar night instead of a sunrise. To see what would change if the spin stopped, read what if Earth stopped rotating.
Earth’s size and shape
Earth is not a perfect sphere. Its rotation makes it bulge at the equator, so it is an oblate spheroid.
- Mean radius: 6,371 km.
- Equatorial radius: 6,378 km.
- Polar radius: 6,357 km.
- Flattening: about 1 part in 298, a difference of 21 km between the equatorial and polar radius.
The model draws a sphere of the mean radius. A flattening of 1 in 298 is smaller than the width of a line on screen, and a sphere keeps the measure tool simple: distances are great-circle distances on a 6,371 km sphere, which agree with the true figure to within about half a percent. The terrain, though, is stretched. Everest is 8.8 km high on a planet 6,371 km in radius, 0.14 percent of the radius. At true scale it would be a barely visible texture. The exaggeration slider multiplies the height so the Himalayas and the trenches show. Set it to 1 for the true proportions.
Highest, lowest and deepest points on Earth
All heights are measured from mean sea level, except where stated.
- Mount Everest is the highest point above sea level, 8,849 m, on the border of Nepal and China.
- Challenger Deep, in the Mariana Trench, is the deepest known point in the ocean, about 10,935 m below the surface. Everest would fit inside it with more than 2 km of water above the summit.
- The Dead Sea shore is the lowest dry land, about 430 m below sea level, and it drops by roughly a metre a year as the lake shrinks.
- Mauna Kea in Hawaii is the tallest mountain measured from its base: more than 10,210 m from the sea floor to the summit, though only 4,207 m shows above the water.
- Chimborazo in Ecuador is the point on land farthest from Earth’s centre. Its summit is only 6,263 m above sea level, but it sits on the equatorial bulge and is more than 2 km farther from the centre than Everest.
Those last two entries show why “highest” has three answers: above sea level, base to peak and distance from the centre. Open the Places panel to fly to each and compare.
What the ocean floor looks like with the water drained
Oceans cover about 71 percent of Earth, and their average depth is about 3,680 m. Turn the Oceans layer off and the globe shows what is under them.
- The Mid-Atlantic Ridge runs down the middle of the Atlantic for about 16,000 km, a seam where the plates pull apart and new crust forms.
- Trenches ring the Pacific, the deepest in the west. The Mariana Trench is the deepest of them. The Puerto Rico Trench is the deepest in the Atlantic.
- Seamounts, undersea volcanoes, dot the Pacific floor. Some rise to form islands, as the Hawaiian chain does.
- Wide, flat abyssal plains cover most of the floor between the ridges and the continental shelves.
The sea floor comes from the ETOPO 2022 model. In the open ocean it is based mainly on satellite measurements of the sea surface, which bulges slightly over underwater mountains, with ship soundings where they exist. That is good enough for the shape of the basins and not for navigation.
Earth from space
For most of human history nobody saw the whole Earth. Three photographs changed that.
- Earthrise, 24 December 1968. Apollo 8 astronaut Bill Anders photographed Earth rising over the lunar horizon while the crew orbited the Moon. It is the first colour photograph of Earth rising over the Moon.
- The Blue Marble, 7 December 1972. The Apollo 17 crew took it on the way to the Moon, with the Sun behind them so the full disc was lit. Apollo 17 was the last crewed mission beyond low Earth orbit, and the photograph is still the best known image of Earth.
- Pale Blue Dot, 14 February 1990. Voyager 1 turned its camera back from about 6 billion km away. Earth is less than one pixel in the frame, a point in a band of scattered sunlight.
Whole-Earth images today are not single photographs. A satellite sees only a strip of the planet on each orbit, and clouds hide much of the ground. NASA builds the images by stitching strips from many orbits and choosing the clearest pixels for each place. The Blue Marble Next Generation, used for the colour on this globe, is a set of twelve monthly cloud-free images made from a year of data from the MODIS instrument on the Terra satellite, at a resolution of 500 m a pixel. The model shows the July version. The NASA missions to Earth post lists the satellites that collect this data.
Earth at night
With day and night on, the dark side of the globe shows city lights. They come from NASA’s Black Marble 2016 map, made from the VIIRS instrument on the Suomi NPP satellite, which picks the clearest nights of the year for each place.
The lights map where electric lighting is, which tracks population and wealth but not one-to-one. Eastern North America, Europe, Japan, the Nile valley and the coasts of India and China glow. Large areas of Africa, Siberia, the Amazon, the Sahara and Australia’s interior stay dark, and so does North Korea, which shows as a black area between brightly lit South Korea and China. Fishing fleets and gas flares appear as isolated bright patches away from cities. Move the clock through a day to watch the lights fade out in the morning twilight and come on again at dusk.
How sharp is the globe? Can I see my house?
No. The sharpest colour texture is 8,192 pixels across the full 360 degrees of longitude, so one pixel is about 5 km at the equator. Cities appear as colour changes and not as streets. Imagery at the level of a house comes from services like Google Earth and Bing Maps, which use aerial photographs. This model is built to show the whole planet, its relief, its seasons and its lighting.
3D world map or flat map?
The globe is the undistorted view, since a sphere has no projection. The flat map is an equirectangular projection, with latitude and longitude as a straight grid. It shows the whole world at once, but it stretches everything sideways toward the poles, so Greenland, Alaska and Antarctica look far wider than they are. Switch between the two views and watch a country change shape. The grid layer makes the stretching easy to see.
Questions people ask
Is this Earth map live?
Partly. The Sun's position and the day and night line are calculated for the time on the clock, so they are real. The clouds are a fixed NASA composite, the city lights are NASA's 2016 Black Marble map and the surface colour is a 2004 satellite composite. None of those show current weather or new construction.
Where is it night right now?
Open the globe with the clock on Now. The side facing away from the Sun is dark, the soft band along the day and night line is twilight, and city lights glow in the dark half. Tap any point to read its local solar time, the Sun's height and today's sunrise and sunset.
Can I see my house on this globe?
No. The sharpest texture has about 5 km per pixel at the equator, so you can see cities, coastlines, lakes and mountain ranges but not streets or buildings. Street-level views come from aerial photography in services like Google Earth and Bing Maps. This model is made for the whole planet, its relief and its lighting.
Why does the day and night line tilt?
Earth's axis is tilted 23.44 degrees to its orbit. The terminator is always 90 degrees from the point directly under the Sun, and that point moves between 23.44 degrees north in June and 23.44 degrees south in December. At the equinoxes the line runs straight through both poles. Scrub the clock through a year to watch it.
What is the highest point on Earth, and what is the deepest?
Mount Everest is the highest point above sea level at 8,849 m. The deepest known point is Challenger Deep in the Mariana Trench, about 10,935 m below the surface. Measured from its base on the sea floor, Mauna Kea is taller than Everest, and Chimborazo is farther from Earth's centre.
Is Earth a perfect sphere?
No. Earth bulges at the equator because it spins. The equatorial radius is 6,378 km, the polar radius 6,357 km and the mean radius 6,371 km, a flattening of about 1 part in 298. The model draws a sphere of the mean radius and exaggerates the terrain, with a slider you can set back to 1.
How accurate are the heights and ocean depths?
Land heights and ocean depths come from NOAA's ETOPO 2022 global relief model. In the open sea the depths are mainly estimated from satellite measurements of the sea surface, with ship soundings where they exist. The data is good for the shape of mountains, basins and trenches. It is not survey grade and should not be used for navigation.
What are the lights on the night side?
They are NASA's Black Marble 2016 map of artificial light at night, made from the VIIRS instrument on the Suomi NPP satellite using the clearest nights of the year. The lights follow population and wealth, so Europe, eastern North America and Japan blaze while Siberia, the Sahara and the Amazon stay dark.
Where the data comes from
- NASA Blue Marble Next Generation with topography and bathymetry, July 2004 (world.topo.bathy.200407.3x21600x10800.jpg) (Public domain (US Government work, NASA / NOAA))
- NOAA NCEI ETOPO 2022 Global Relief Model, 60 arc-second, ice surface (ETOPO_2022_v1_60s_N90W180_surface.tif) (Public domain (US Government work, NASA / NOAA))
- NASA Earth Observatory Black Marble 2016 color maps: Earth at Night (BlackMarble_2016_3km.jpg) (Public domain (US Government work, NASA / NOAA))
- NASA Visible Earth: Blue Marble: Clouds, cloud composite (cloud_combined_8192.tif) (Public domain (US Government work, NASA / NOAA))
- Natural Earth 1:50m Cultural Vectors, admin 0 – boundary lines land (Public domain)
- Natural Earth 1:50m admin 0 countries and 1:10m populated places (simple) (Public domain)
- World Bank Open Data: Population, total (SP.POP.TOTL) and Surface area (AG.SRF.TOTL.K2) (CC BY 4.0)
- Landmark facts (heights, depths, lengths, records) (Facts; citations only)
- Region label points (continents, oceans, seas, physical regions) (Own work)


Data verified 2026-10-20. The same kind of model exists for the Moon, Mercury, Venus, Mars, Jupiter, Saturn, Uranus and Neptune. To compare Earth with its neighbour, read Earth and Mars: differences and similarities, or see objects larger than Earth for scale.