
When Landsat 1 lifted off in 1972 it began the longest continuous record of Earth from space — a data stream that climate scientists still rely on today. That archive, combined with later missions from NASA and ESA, lets researchers detect long-term trends (rather than short-term noise) and deliver truly global coverage that ground stations alone can’t provide. Ground networks are essential, but they can’t map entire oceans, remote ice sheets, or urban methane plumes with consistent, repeatable observations.
Space-based measurements have become indispensable: they reveal atmospheric composition, track ice and water mass, monitor land-use change, and furnish independent verification for emissions claims. This piece lays out eight concrete ways satellites and other space missions shape climate science — from measuring greenhouse gases and aerosols to improving forecasts and informing policy.
Satellites and Earth Observation
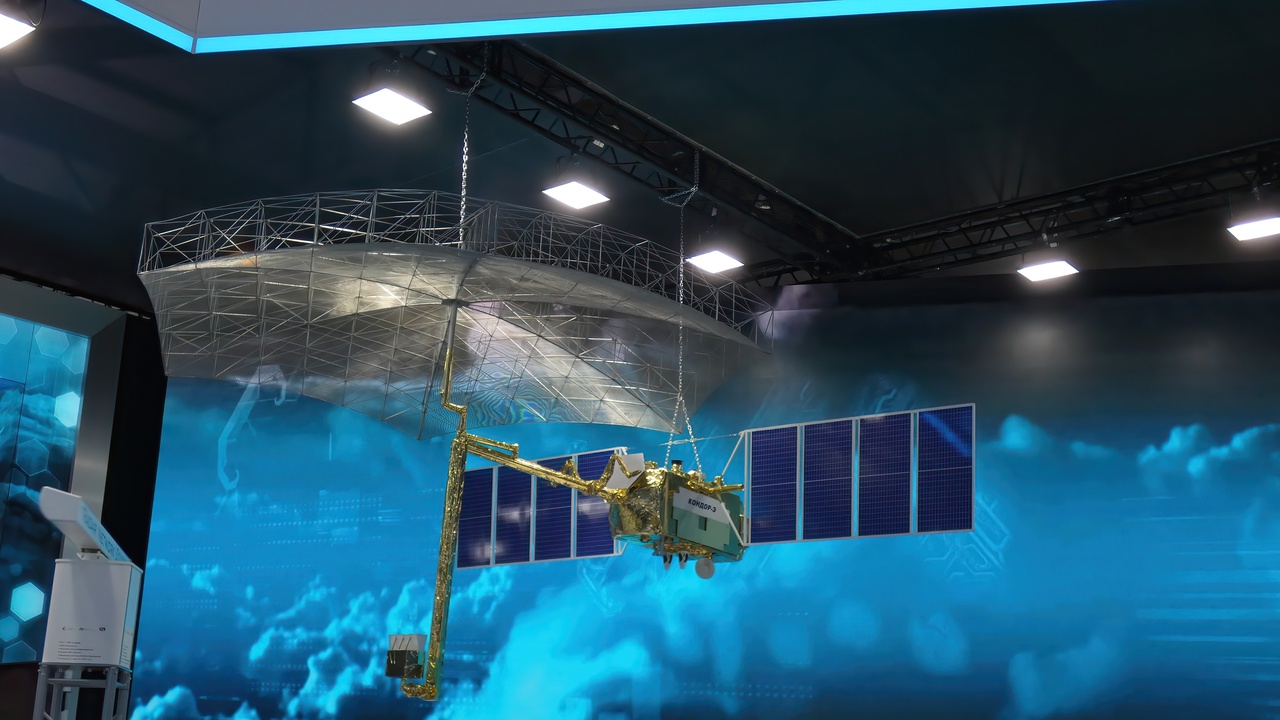
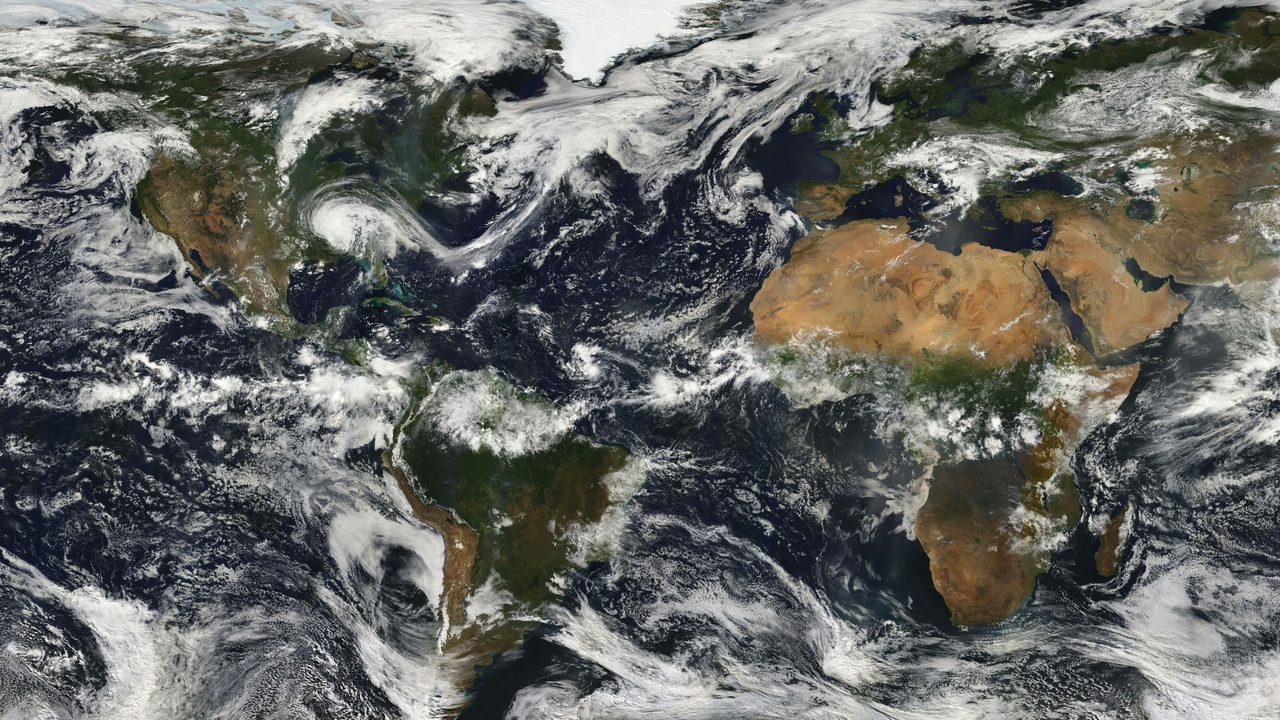
Satellites are the foundation of modern climate monitoring: they provide continuous, repeatable, global observations that fill gaps left by sparse in-situ networks. Foundational missions include Landsat (1972), the MODIS instruments on Terra (1999) and Aqua (2002), and ESA’s Sentinel series (from 2014 onward).
Below are two major measurement capabilities that exemplify how satellite systems change what we can measure and why those measurements matter.
1. Measuring greenhouse gases from orbit
Satellites produce global maps of CO2, methane, and other gases that simply aren’t possible from surface networks alone. Missions like OCO-2 (launched 2014), OCO-3, and ESA’s TROPOMI (2017) measure column concentrations with ppm- to sub-ppm sensitivity for CO2 and detect methane plumes at high spatial resolution.
Atmospheric CO2 reached roughly 420 ppm in 2023, and methane is now about 1,900 ppb — roughly 2.7 times preindustrial levels (preindustrial ~700 ppb). Those numbers are tracked from orbit and used to identify regional flux anomalies (OCO-2), pinpoint oil-and-gas leaks (TROPOMI), and verify national inventories.
Commercial providers (GHGSat, Planet Labs, for example) add high-resolution imagery for targeted monitoring of point sources, enabling measurement, reporting, and verification (MRV) applications that policymakers and regulators rely on.
2. Tracking aerosols and air quality from space
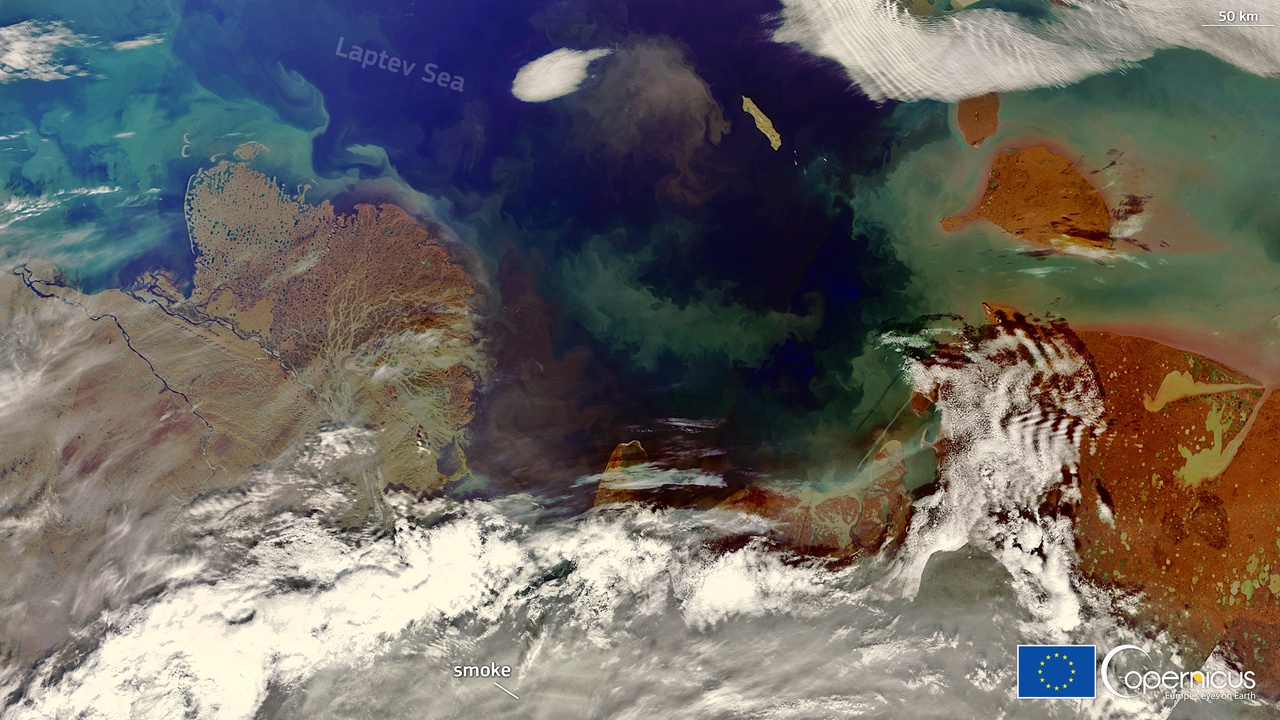
Aerosols influence climate forcing and human health, and satellites map aerosol optical depth (AOD) and wildfire smoke over broad regions. Instruments like MODIS, VIIRS, and CALIPSO provide horizontal coverage and vertical profiles that are impossible from surface sites alone.
MODIS and VIIRS routinely detect tens of thousands of thermal anomalies (fires) each season; during the 2019–2020 Australian bushfires those sensors tracked smoke plumes crossing entire oceans. CALIPSO’s lidar profiles help separate smoke layers from dust and clouds, improving model estimates of aerosol radiative forcing.
That information feeds air-quality forecasts and public-health advisories, and it supplies inputs for climate models used in attribution studies and policy planning.
Cryosphere and Sea-Level Observations
Space systems give precise, repeatable measures of ice mass, elevation, and global sea level — data that are essential for assessing coastal risk and detecting accelerations in ice loss. Key missions include GRACE (2002), GRACE-FO (2018), ICESat-2 (2018), and CryoSat.
The next two subsections summarize how those measurements are used.
3. Measuring ice loss and glaciers from orbit
GRACE and GRACE-FO detect gravity changes tied to mass loss, while laser altimeters like ICESat-2 measure surface elevation changes with meter-to-centimeter precision. Together they quantify ice-sheet and glacier trends.
Recent estimates place Greenland’s mass loss in the range of about 200–300 gigatons per year in recent decades, with Antarctica also contributing a growing share. Those losses translate directly into global sea-level rise and are used to project coastal impacts for cities and island nations.
Satellite records also document dramatic glacier examples — Jakobshavn Isbræ in Greenland has retreated and thinned markedly over the satellite era — and reveal seasonal to multi-year variability that ground campaigns alone would miss.
4. Tracking global sea-level rise with radar altimetry
Radar altimeters have delivered a continuous global mean sea-level record since TOPEX/Poseidon in 1992 and the Jason series (Jason-1 launched 2001), with Sentinel-6 joining the record after 2020. These instruments measure ocean-surface height with millimeter-to-centimeter accuracy.
Satellite altimetry shows global mean sea level rising at about 3.3 mm per year since 1993, with regional variations (the western Pacific is a known hotspot). That trend and its acceleration are central inputs to IPCC assessments and to coastal planning and adaptation strategies.
Altimetry also helps separate contributors to sea-level change — thermal expansion, glacier melt, and ice-sheet mass loss — when combined with GRACE, ARGO floats, and other datasets.
Water, Carbon and Land-Use Cycles
Satellites close major observational gaps in the hydrological and carbon cycles and provide continuous land-cover records that are essential for carbon accounting and resource management. Landsat’s archive (1972–present), GRACE/GRACE-FO, MODIS, and OCO-2 are central to these efforts.
Two key ways space data are used: gravity-based water storage monitoring and land-use/carbon-sink tracking.
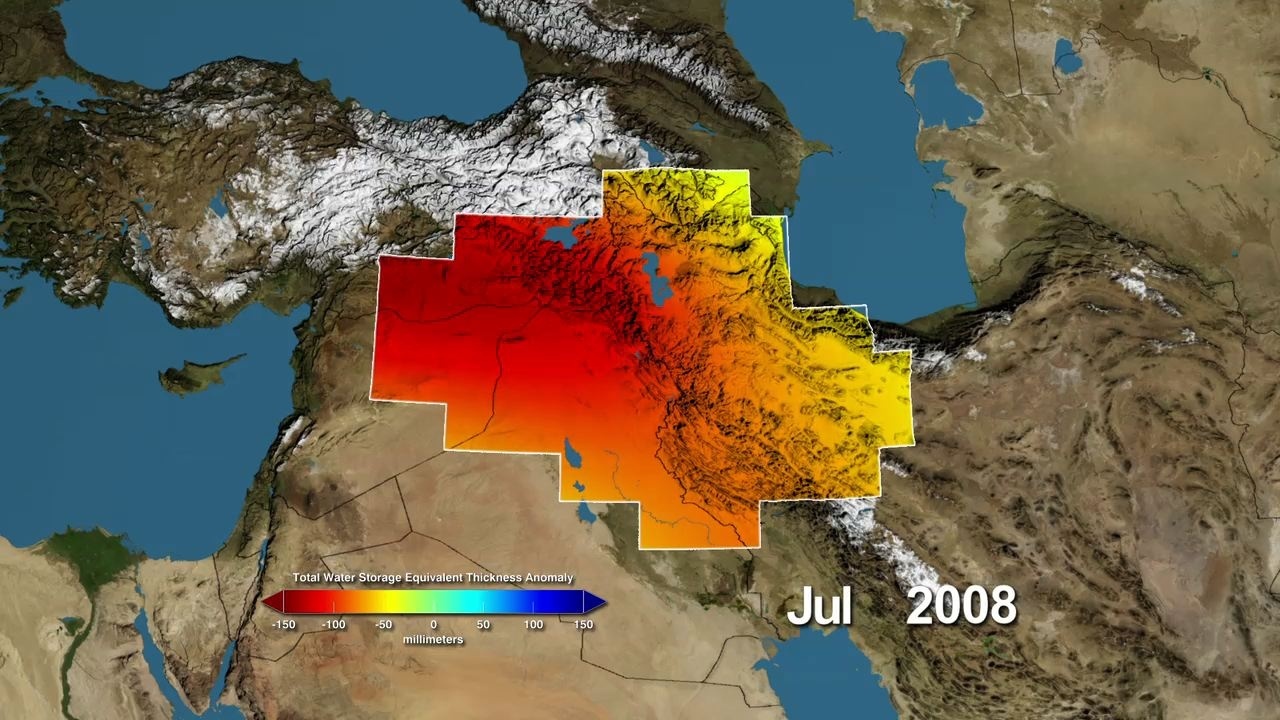
5. Mapping terrestrial water storage and drought with gravity data
GRACE (launched 2002) and the follow-on GRACE-FO (2018) measure changes in Earth’s gravity field caused by redistributions of mass, revealing groundwater depletion, large-scale reservoir loss, and basin-scale drought signals.
GRACE data have documented major aquifer depletion in northwest India and persistent groundwater loss in California’s Central Valley, quantified in billions of cubic meters per year. Those objective mass-change measurements are now used in water-resource planning and drought early-warning systems.
6. Tracking land-use, vegetation, and the carbon sink
Satellite imagery from Landsat and high-cadence sensors maps deforestation, urban expansion, and vegetation health across decades. Vegetation indices (NDVI from MODIS, for example) feed carbon-flux models and help estimate how much CO2 terrestrial ecosystems absorb each year.
Products like Global Forest Watch (built on Landsat/VIIRS) report forest loss and are used to monitor REDD+ projects and national inventories. OCO-2 provides atmospheric context to link surface changes to carbon fluxes.
High-frequency commercial imagery (Planet Labs, for example) adds near-real-time detection of rapid land change, which is critical when enforcement or rapid mitigation is needed.
Modeling, Forecasting and Policy Verification
Space-derived observations aren’t just for measurement — they feed models, improve forecasts, and provide independent verification that supports policy and finance decisions. Data assimilation, reanalyses, and emissions verification are three major roles.
The following two subsections highlight model improvement and policy-relevant verification.
7. Improving models and forecasts with data assimilation
Operational centers (ECMWF, NOAA, NASA) assimilate satellite radiances and retrievals into numerical weather prediction and climate reanalyses (ERA5 being a prime example). That assimilation raises forecast skill and reduces uncertainty in both short-term weather and longer-term climate products.
Including satellite sea-surface temperatures, soil moisture, and atmospheric composition has measurably improved seasonal forecast accuracy and hurricane-track predictions. Reanalyses that rely heavily on satellite inputs produce consistent historical datasets for attribution and impacts studies.
8. Verifying emissions and informing policy decisions
Satellites provide independent, defensible evidence to verify national emissions and to increase transparency under international frameworks. Instruments such as TROPOMI and targeted sensors (GHGSat) have identified super-emitter methane plumes and quantified urban and facility emissions.
This capability supports policymaking and climate finance by prioritizing mitigation investments and strengthening carbon-market integrity. That kind of monitoring is a clear example of space impacts on climate science — it turns remote sensing into actionable evidence for regulators, negotiators, and investors.
Detection thresholds vary by instrument, but combined government and commercial datasets now allow mapping from continental scales down to individual large facilities, improving both accountability and the targeting of emissions-reduction measures.
Summary
Space-based observations underpin modern climate science in measurement, modeling, and verification.
- Satellites deliver global, long-term records (Landsat archive since 1972) that reveal trends you can’t see from local stations alone.
- Orbital sensors measure greenhouse gases (OCO-2, TROPOMI), aerosols (MODIS, CALIPSO), and water and ice mass (GRACE 2002, GRACE-FO 2018; ICESat-2 2018).
- Radar altimetry has tracked global mean sea-level rise (~3.3 mm/yr since 1993), while GRACE and altimeters together attribute contributors to that rise.
- Satellite data improve forecasts through assimilation (ERA5, operational centers) and provide independent verification of emissions—vital for policy, MRV, and climate finance.
- Continued investment in open, high-quality space data (NASA, ESA, NOAA) and integration with commercial sensors will strengthen science, transparency, and adaptation planning.
Enjoyed this article?
Get daily 10-minute PDFs about astronomy to read before bed!
Sign up for our upcoming micro-learning service where you will learn something new about space and beyond every day while winding down.


