
The 1859 Carrington Event was a vivid demonstration of solar danger: a massive solar flare and associated coronal mass ejection (CME) induced currents that disrupted telegraph systems around the globe and produced aurora as far south as the Caribbean. That single episode still sets the benchmark for extreme space weather risk to modern infrastructure. Predicting solar storms matters today because our society runs on satellites, high-voltage power grids, aviation communications and global navigation systems—one severe geomagnetic storm could force grid operators to shed load or satellite teams to put spacecraft into safe mode (a real operational cost). I’ll show seven practical, proven ways experts piece together observations, models and alerts to protect systems (and people); SDO was launched in 2010 and continues to provide the high‑cadence imagery that makes many of those methods possible.
A layered approach of continuous observations, physics-based and statistical models, and timely alerts gives the best practical forecasts for protecting satellites, grids, and communications.
This article lists seven practical methods that forecasters and operators use to convert solar activity into advance warning and action.
Ground-based and Remote Observations
Ground-based telescopes, coronagraphs and radio arrays are often the first to reveal evolving activity on the Sun’s surface and low corona. They deliver continuous, high‑cadence context that complements spacecraft measurements: optical imagers and coronagraphs show filament destabilization and emerging sunspots, radio systems capture bursts linked to particle acceleration, and magnetometer stations measure local ground impact as storms arrive. These networks provide early hints of an event’s potential severity and help validate models and forecasts. Operational groups use this layered ground picture to confirm spacecraft detections and to tweak model inputs before issuing watches or warnings.
1. Direct Solar Imaging: Coronagraphs and Solar Telescopes
Coronagraphs and solar telescopes reveal eruptions and CMEs as they form and lift off from the Sun. Instruments such as SOHO’s LASCO (operational since 1995) and ground coronagraphs like the Mauna Loa K‑Coronagraph provide the imagery used to measure CME speed, angular width and apparent direction. These measurements feed arrival‑time models and often give operators 1–3 days of lead time for Earth‑directed CMEs. Forecasters use speed and width estimates from coronagraph movies to initialize propagation models, while satellite teams rely on that lead time to switch instruments to safe modes or adjust pointing. In practice, a clear LASCO sequence showing a fast, wide CME is a trigger for operational alerts and model runs.
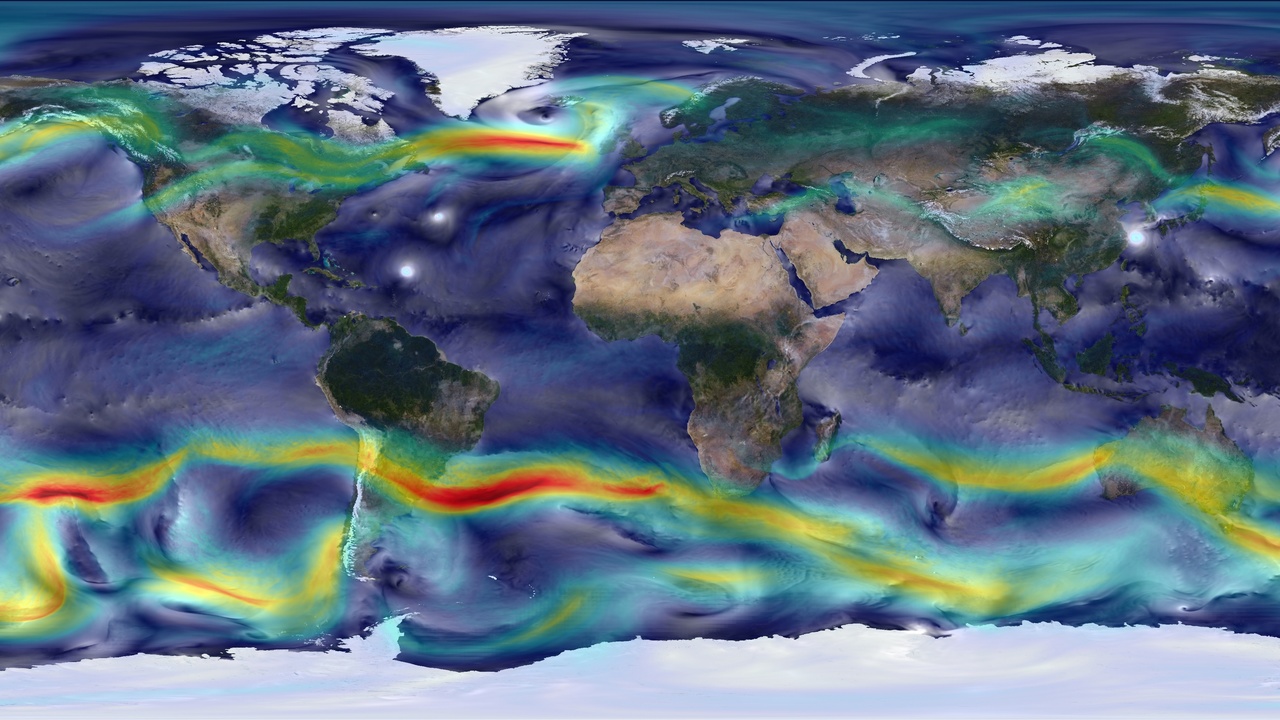
2. Magnetometer Networks: Monitoring Earth’s Magnetic Response
Magnetometer networks measure ground‑level magnetic perturbations that indicate a geomagnetic storm is underway. Global arrays such as INTERMAGNET and research platforms like SuperMAG provide near‑real‑time station data and indices (Kp, Dst) that quantify disturbance strength. For example, a Kp value above 5 denotes a geomagnetic storm capable of affecting high‑latitude power systems; utilities monitor these indices to decide when to apply mitigation measures. Pipeline operators and rail systems also watch for rapid magnetic fluctuations because induced currents can accelerate corrosion or interfere with signaling. Agencies and utilities use those magnetic trends to time operational responses and to validate whether a modeled CME impact is materializing.
3. Radio Monitoring and Interplanetary Scintillation
Radio observations catch energetic phenomena that optical instruments can miss and track plasma moving between Sun and Earth. Type II radio bursts indicate shock waves and potential proton acceleration; Type III bursts reveal rapid electron beams tied to flares. Interplanetary scintillation (IPS) techniques — used by dedicated IPS arrays and arrays like LOFAR — detect density structures in the solar wind and can trace CME propagation en route to Earth. HF radio and GNSS users rely on radio‑burst alerts because those bursts predict imminent HF degradation and GNSS scintillation. IPS data also give forecasters earlier information on CME speed and density structure before L1 monitors arrive.
Space-based Monitors and Probes
Spacecraft near Earth and closer to the Sun supply direct measurements of the solar wind, magnetic field, energetic particles and high‑resolution imagery that ground assets can’t obtain. Spacecraft like ACE (launched 1997) and DSCOVR (arrived at L1 in 2015) deliver real‑time plasma and field data, while observatories such as SDO (launched 2010), Parker Solar Probe (2018) and Solar Orbiter (2020) improve our physical understanding of eruption drivers. Those missions provide lead times ranging from minutes (L1 monitors) to days (upstream imaging and remote sensing), and their combined data stream supports both operational alerts from NOAA SWPC and scientific refinement of forecast models used by NASA and ESA partners.
4. L1 Solar Wind Monitors: ACE, DSCOVR and Real-time Alerts
Spacecraft positioned near the Sun–Earth L1 point (about 1.5 million km sunward) measure the plasma and magnetic field that will arrive at Earth minutes to an hour later. L1 platforms such as ACE (1997) and DSCOVR (moved to L1 in 2015) provide direct readings of solar wind speed, density, temperature and the interplanetary magnetic field. Typical warning times from those platforms range roughly 15–60 minutes depending on solar wind speed. Operators use sudden increases in density or a southward IMF turning reported from L1 to trigger immediate responses—satellite teams change operational modes and grid operators brace for rapid geomagnetically induced current spikes—while NOAA SWPC incorporates those streams into watches and warnings.
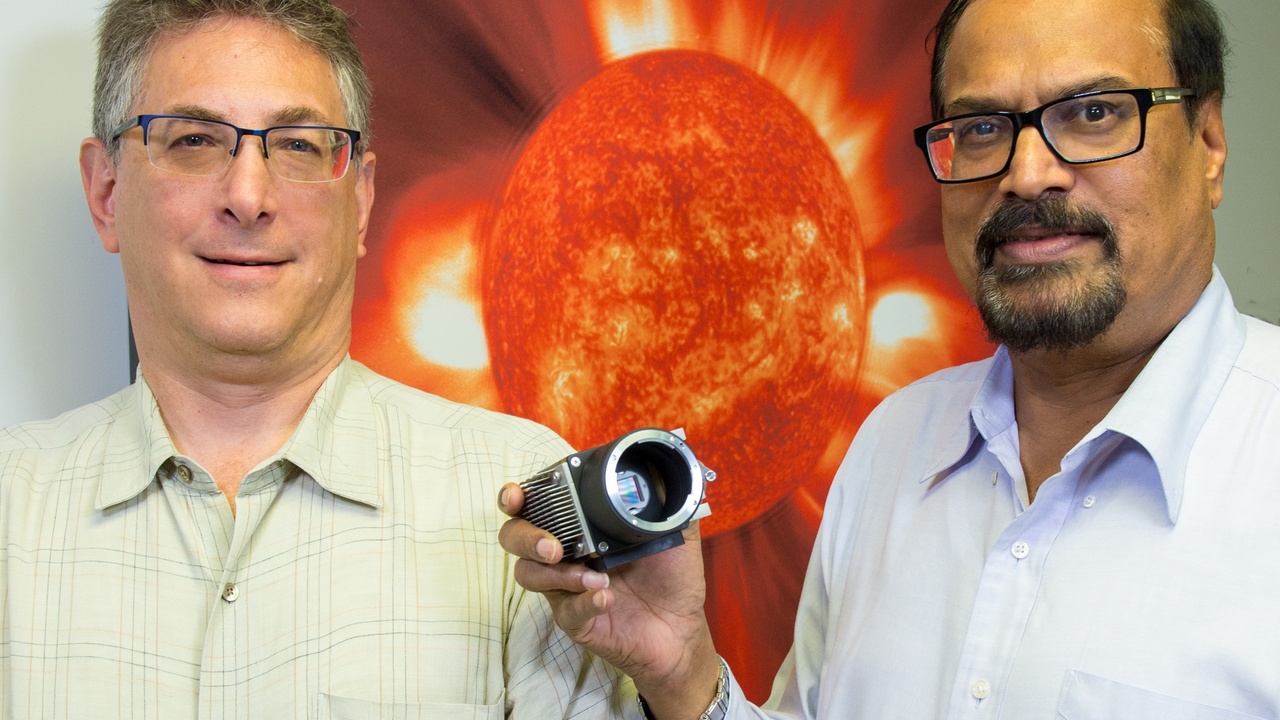
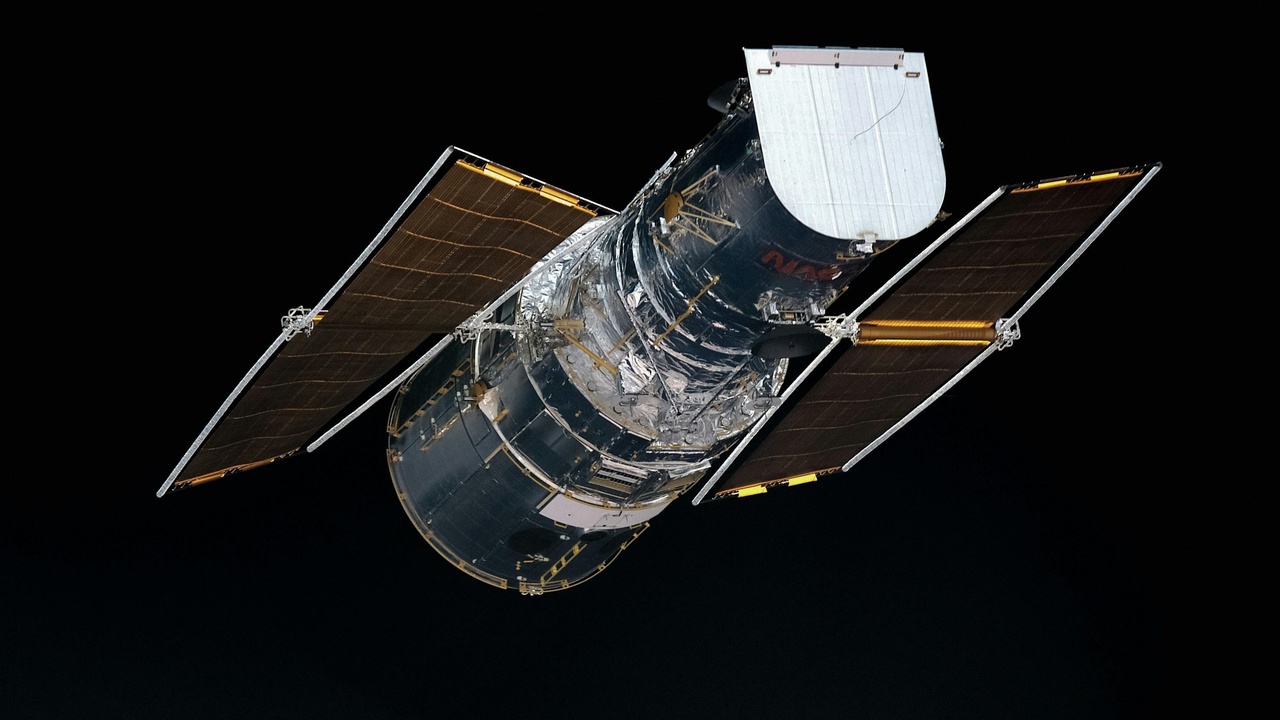
5. Solar Observatories: SDO, Parker Solar Probe and Solar Orbiter
Modern solar observatories deliver high‑cadence imagery and in‑situ sampling that reveal eruption physics and particle acceleration. SDO (2010) provides continuous extreme‑ultraviolet imaging and helioseismic data that show sunspot evolution and flare precursors; Parker Solar Probe (2018) samples the near‑Sun plasma environment and Solar Orbiter (2020) combines remote sensing with in‑situ instruments. These missions improve inputs for CME and particle models and help reduce false alarms by clarifying whether a magnetic configuration is likely to erupt. Aviation and human spaceflight program managers use radiation‑risk assessments informed by these observatories to alter flight paths or schedule EVAs when elevated energetic particle fluxes are forecast.
Models, Forecasting Techniques, and Alerts
Turning observations into actionable forecasts relies on physics‑based models, ensemble approaches and data‑driven methods. Physics models simulate CME propagation and ambient solar wind, ensembles quantify uncertainty, and machine‑learning methods have improved short‑range classification and particle predictions. Operational centers such as NOAA’s Space Weather Prediction Center use this blend to produce watches, warnings and alerts; ESA and national agencies run parallel services. For teams asking how to predict space weather in an operational sense, combining imaging, in‑situ data and probabilistic outputs has become standard practice to give users a clear sense of timing and risk.
6. Physics-based Models: WSA–Enlil, EUHFORIA and CME Propagation
Physics‑based models simulate the solar wind and CME travel through the heliosphere to estimate arrival time and potential impact strength. Operational systems commonly use WSA–Enlil and Europe’s EUHFORIA to propagate CMEs from coronagraph‑derived inputs; CME forecasts aim for 24–72 hours lead time, with arrival‑time uncertainties often on the order of ±12 hours depending on CME structure. Inputs like CME speed, width and direction come from coronagraph imagery and heliospheric observations. Grid operators and satellite controllers consult these model outputs to decide when to reduce load, reorient spacecraft or suspend sensitive operations, making the models a core part of operational planning.
7. Statistical, Ensemble and Machine-Learning Forecasts plus Alerting Systems
Statistical methods and machine‑learning tools augment physics models by recognizing patterns and improving short‑term skill, while ensemble forecasting provides probabilistic guidance. Research teams at NASA, NOAA and European universities have shown ML can boost flare classification and short‑term particle flux predictions, and ensembles give users a quantified uncertainty to weigh risk. Operational alerting systems—NOAA SWPC in the U.S., ESA’s services in Europe and regional centers—distribute watches, warnings and alerts that airlines, satellite operators and grid companies ingest automatically. Those automated alerts let stakeholders adjust flight routes, change satellite power states or implement grid mitigation steps with seconds to hours of lead time depending on the trigger.
Summary
- Ground and remote systems (solar telescopes, coronagraphs, radio arrays and magnetometer networks) provide continuous, high‑cadence context and early indicators—useful for detecting filament destabilization, radio bursts and sunspot growth that hint at storms.
- Spacecraft at L1 (about 1.5 million km) like ACE (1997) and DSCOVR (2015) give short, crucial warnings (minutes to an hour) while solar observatories (SDO 2010, Parker Solar Probe 2018, Solar Orbiter 2020) deliver days‑earlier context and improved physics.
- Physics‑based models (WSA–Enlil, EUHFORIA) aim for 24–72 hour CME arrival forecasts (often ±12 hours uncertainty), and ensembles plus ML methods add probabilistic skill that operators use to plan actions.
- Together—observations, models and operational alerts from NOAA SWPC, NASA and ESA—form the practical toolkit for how to predict space weather; pay attention to official watches/warnings and support continued investment in monitoring and modeling to keep infrastructure resilient.
Enjoyed this article?
Get daily 10-minute PDFs about astronomy to read before bed!
Sign up for our upcoming micro-learning service where you will learn something new about space and beyond every day while winding down.

